
Since the DFA and Durbin Amendment became law, banks have had to consider the implications of their growth strategies as they approach the $10 billion asset threshold. Under the DFA, banks that cross over $10 billion in assets face costly regulations such as DFA stress testing, Consumer Financial Protection Bureau oversight and Durbin Amendment compliance, which caps banks’ interchange income.
The Durbin Amendment limits impacted banks’ interchange fees paid by merchants for POS transactions, with the intent of lowering consumer costs by lowering merchant costs. Impacted banks anticipated steep declines in interchange income and increased compliance costs, while banks approaching $10 billion made related planning a critical focus.
Banks impacted by the regulation have dealt with the effects on interchange income and regulatory compliance costs in several ways. They:
Despite initial concerns, many banks both over and under the threshold are now advocates of Dodd-Frank Act Stress Testing (DFAST). Most admit that it forced them to address portfolio data aggregation and reporting challenges, resulting in improved risk management capabilities. Although smaller institutions are not subject to DFAST, many have adopted it in some fashion. In addition, regulatory guidance states that banks with significant concentrations of commercial real estate, for example, should conduct portfolio stress tests of these exposures as part of their ongoing risk management activities. According to the Federal Deposit Insurance Corporation, bank examinations have shown that community banks that proactively plan for, measure and control their vulnerability to adverse events have been better able to adjust and improve their performance over time.
But how have impacted banks and those approaching the threshold fared since DFA/Durbin with respect to point-of-sale (POS) profitability? Have regulatory compliance costs skyrocketed as feared? Were the prognosticators right, or was their case simply “trumped up?”
Many of the four dozen mid-size banks that participated in the latest Cornerstone Performance Report survey are subject to DFA/Durbin. Study data illustrates how banks’ interchange income and enterprise risk management/compliance costs have been impacted since DFA/Durbin’s enactment in 2010.
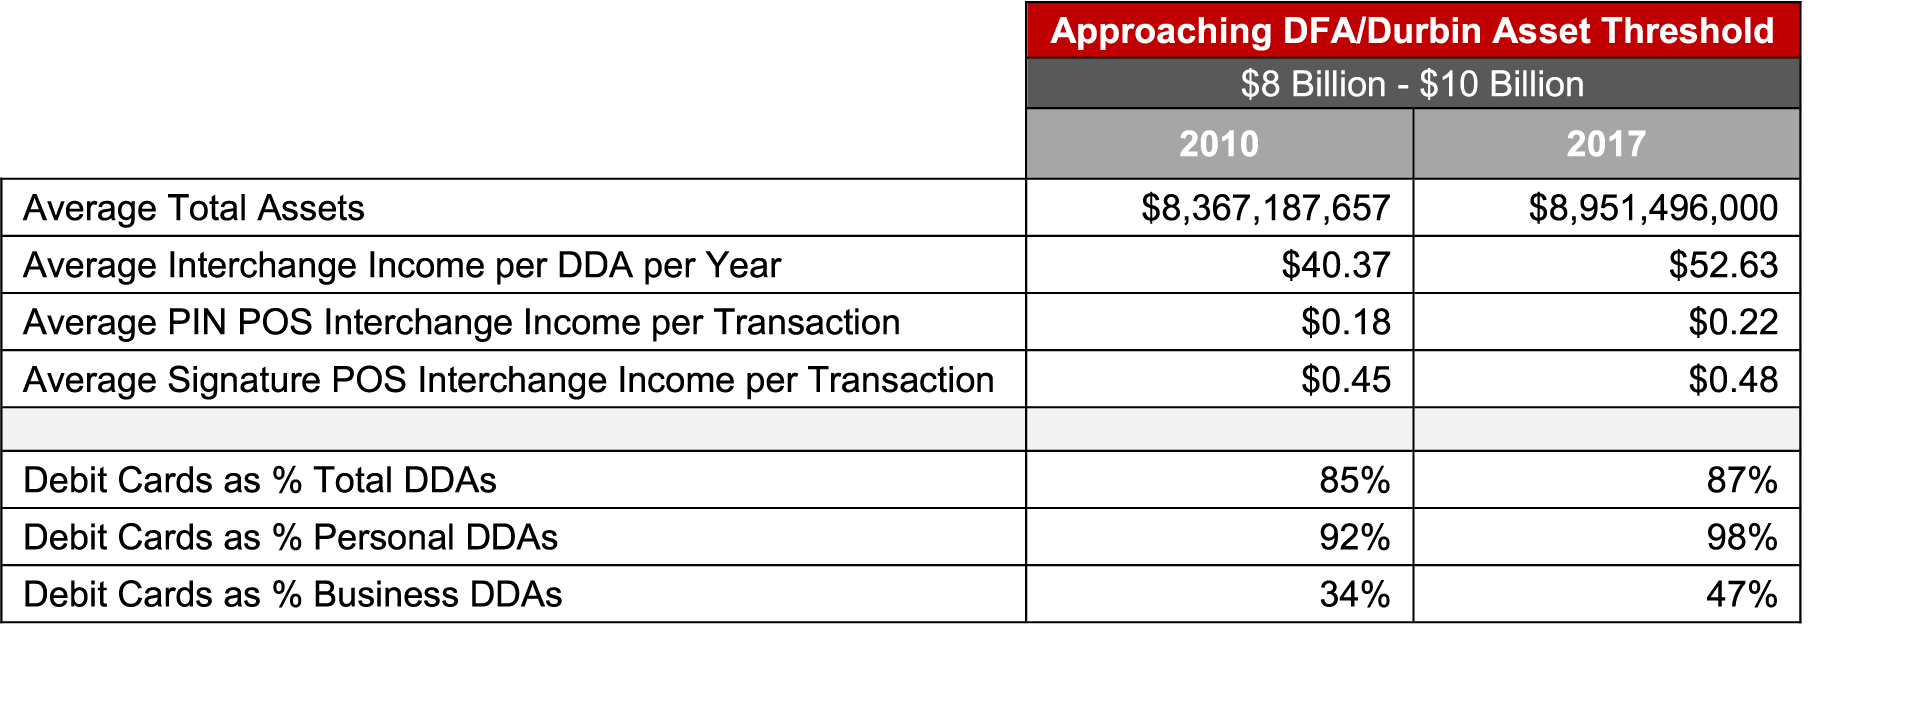
Banks approaching the DFA/Durbin threshold have realized improvements in interchange income, with one reason being the notable improvement in debit card penetration among both personal and business demand deposit accounts (DDAs). Banks approaching the threshold confirmed that they have made concerted efforts, both as part of new account onboarding and via existing account outreach programs, to improve debit card penetration. Banks realize that they can’t earn interchange revenue on DDAs without a debit card or with ATM-only cards, and the noted penetration rate improvement clearly demonstrates these efforts. This trend is likely to continue unabated irrespective of DFA/Durbin’s fate.

Source: 2017 Cornerstone Performance Report for Mid-Size Banks
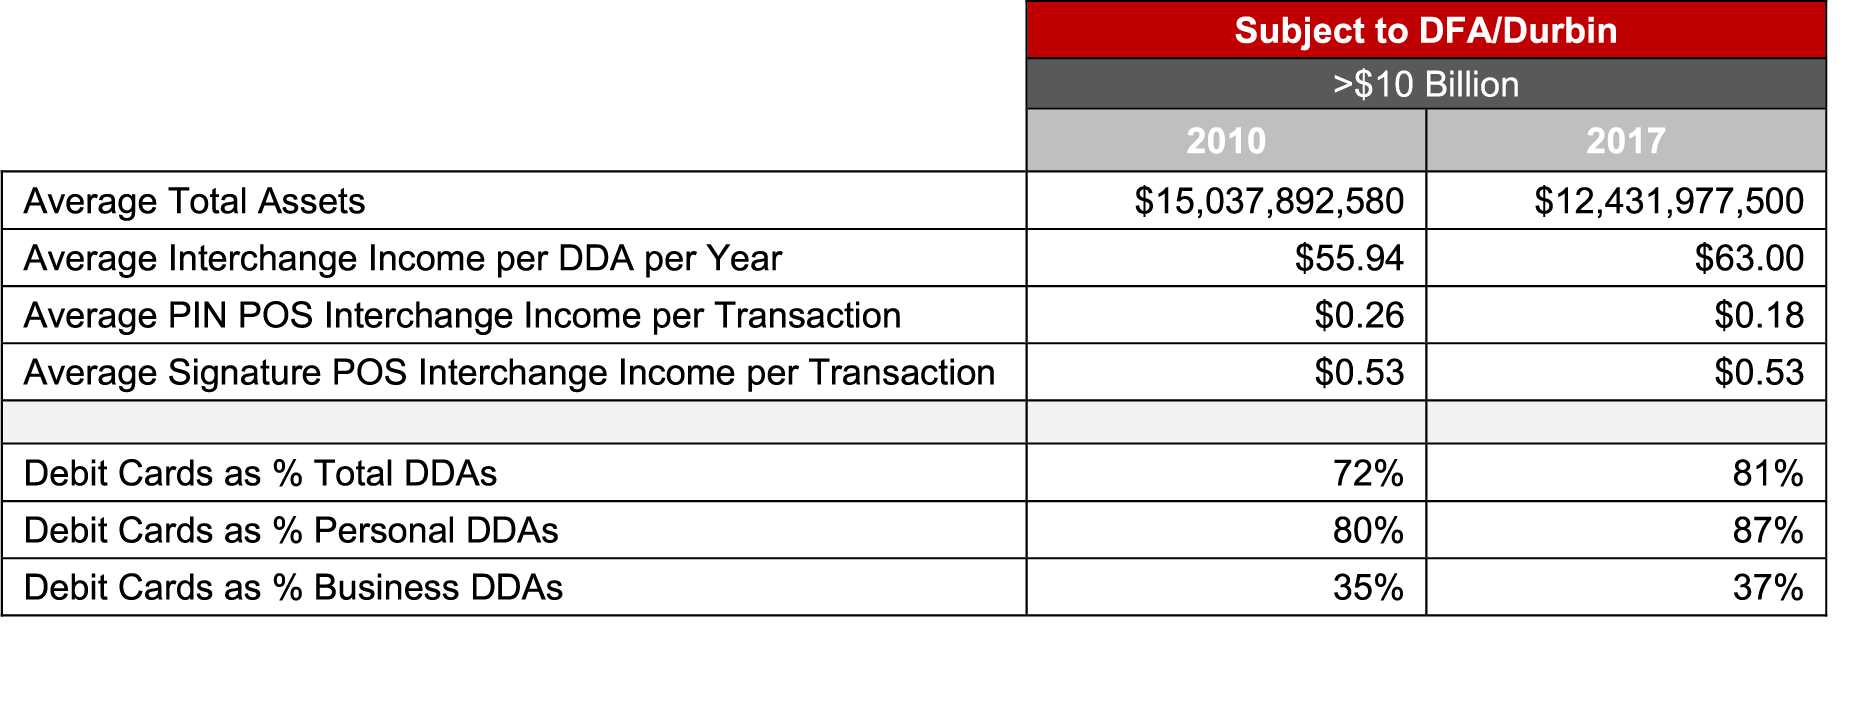
DFA/Durbin-impacted banks in our survey report some surprising results. Although average PIN interchange has declined, average signature interchange has remained flat while average annual interchange income per DDA has increased. This was clearly driven by even stronger increases in debit card penetration, with impacted banks also making daily POS limits and incentives for increased/larger POS transaction areas of focus. There’s no reason why impacted banks wouldn’t have had the same (and even stronger) impetus to focus on these initiatives given DFA/Durbin’s impact on them, as they are all truly a “win-win” for them and their customers.

Source: 2017 Cornerstone Performance Report for Mid-Size Banks
Comparing total bank full-time equivalent (FTE) employees to ERM and compliance FTEs is one indicator of the level of growth of ERM/compliance staff between 2010 and 2017. Interestingly, the growth of overall ERM staffing, and compliance staffing specifically, was higher in institutions approaching the threshold than already above it. This makes sense, as these institutions clearly recognized and aggressively addressed their anticipated DFA/Durbin needs. Surprisingly, though, institutions approaching the threshold are supporting increased regulatory oversight with fewer compliance staff when measured on a relative asset basis.


Source: 2017 Cornerstone Performance Report for Mid-Size Banks
If DFA/Durbin is dealt a “big number” in the coming months (although the likelihood of that appears much lower based on recent reports out of Washington), impacted banks and those approaching the threshold will only benefit if DFA/Durbin’s regulatory reach and interchange cap is shrunk. The industry has already “baked in” the impact of DFA/Durbin by improving risk management practices and restructuring deposit account fees and requirements, and that focus simply will not change.
There’s no going back to the pre-DFA/Durbin days of the lack of robust risk management programs, reporting and DFAST – and that’s a good thing for everyone.
-JG
Thomas Milillo, Cornerstone analyst, contributed to the compilation of cited Cornerstone survey data.
Join us on October 18 at 1PM MST for a webinar where we’ll cover some key benchmark metrics from the upcoming 2017 Cornerstone Performance Report for Mid-Size Banks, mentioned in this article. (intended for financial institutions only)
Learn about past studies here.
The financial crisis was caused by banks and ultimately, they are the industry that came out ahead. Consumers now pay higher fees and independent mortgage brokers and other financial services co’s were decimated b/c they couldn’t afford the regulatory paperwork. Big banks swallowed small ones and small ones had to merge to survive. I wouldn’t call this success. We’re now seeing a similar situation play out in healthcare, where insurance companies win while consumers and doctors continue to lose.
Thanks for your feedback, Patty. The article doesn’t attempt to opine, place blame on or characterize as successful anything, but to compare some key bank metrics that were anticipated to be hugely impacted by DFA/Durbin. However, it is difficult to view resultant improved bank risk management practices and reporting as anything but a win for all parties, including consumers.
While you can compare earnings on Signature vs. PIN then and now… what your chart doesn’t address is the percentage of activity routing each way – which is probably the biggest contributor to overall income.
Thanks for your feedback, Matt. The article attempts to briefly examine some of the hundreds of metrics in the Cornerstone Performance Report, focusing on PIN and Signature interchange income per transaction vs. overall transaction volumes or total interchange income. We felt that per transaction income metrics were the most applicable comparison here, as they factor in volumes by PIN/Signature channel. However, to your point, it is interesting to note that, for DFA/Durbin-impacted banks, the mix of PIN vs. Signature transactions didn’t change all that much between 2010 and 2017: PIN transactions actually increased from 35% to 38% of total POS transactions, while Signature transactions decreased from 65% to 62%.